Overview
- Researchers assembled and verified a spatial dataset of 15,726 cattle and hog feeding sites using government records, community-science leads and satellite imagery.
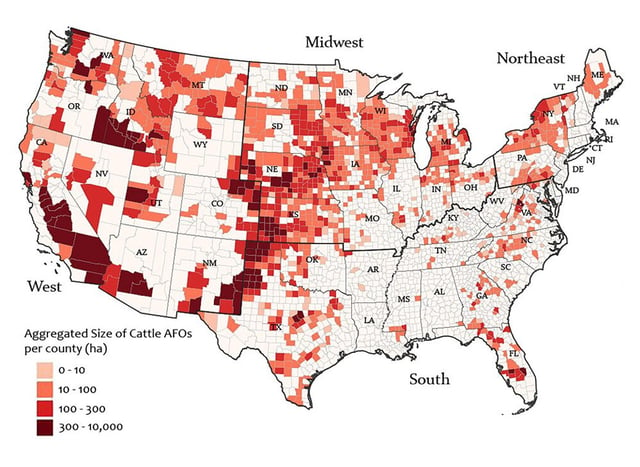
- The operations cover an area equivalent to about 500,000 football fields, with cattle facilities accounting for roughly 80% of that footprint.
- PM2.5 concentrations were on average 28% higher around cattle feedlots and 11% higher near hog farms compared with similar counties without those operations.
- Animal feeding operations are disproportionately sited near socially vulnerable communities characterized by lower health-insurance coverage and education levels.
- Authors recommend using the map to target roughly 30 priority counties for Clean Air Act scrutiny and on-farm measures to reduce particulate emissions.