Overview
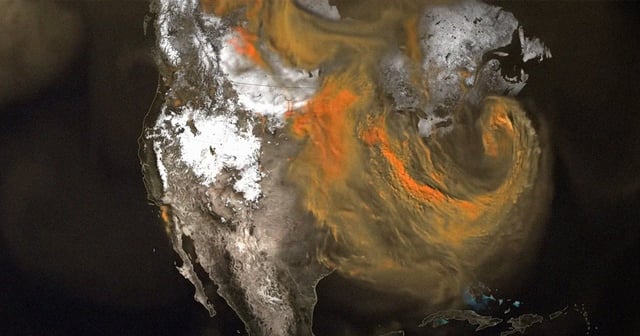
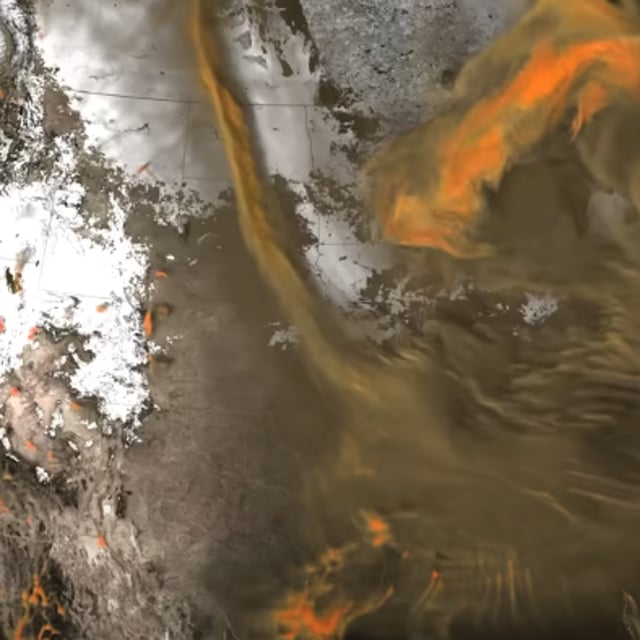
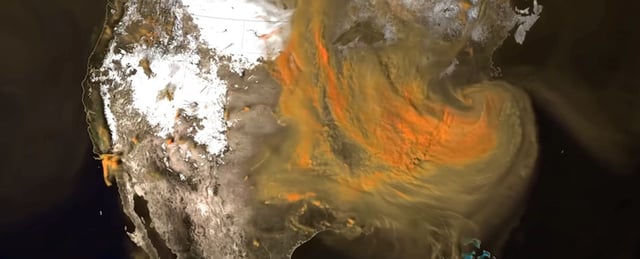
- The video uses billions of data points from satellites and ground sources to track CO2 flow.
- High-resolution model shows emissions from power plants, fires, and transportation in unprecedented detail.
- Emissions in the US, China, and South Asia are primarily from industrial activities and vehicles.
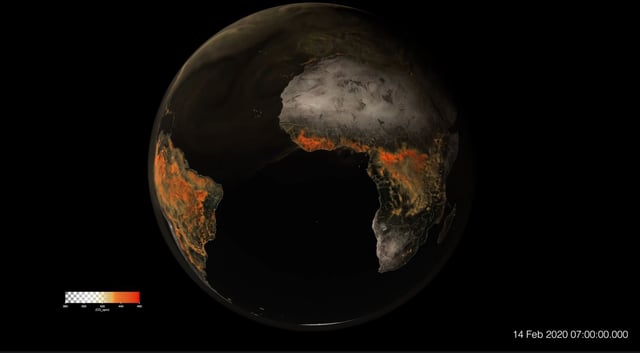
- In Africa and South America, CO2 mainly comes from forest fires and land clearing.
- The visualization underscores the interconnectedness of global CO2 emissions and their effects.