Overview
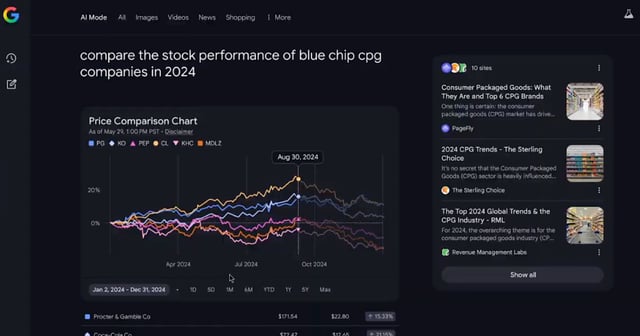
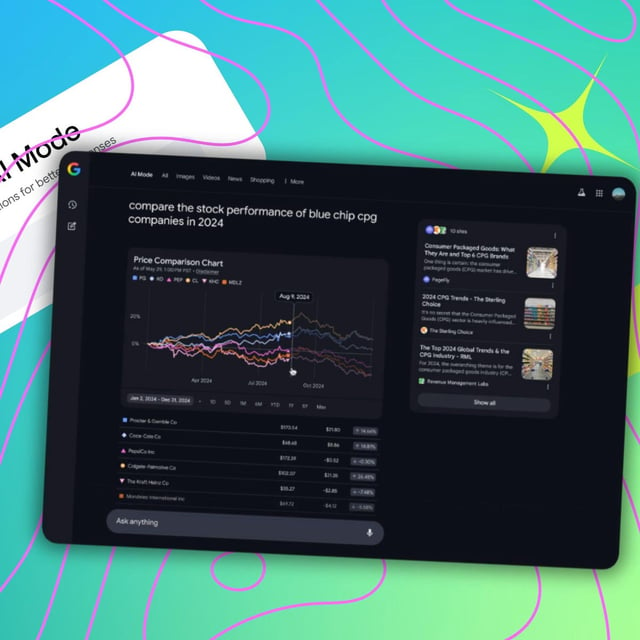
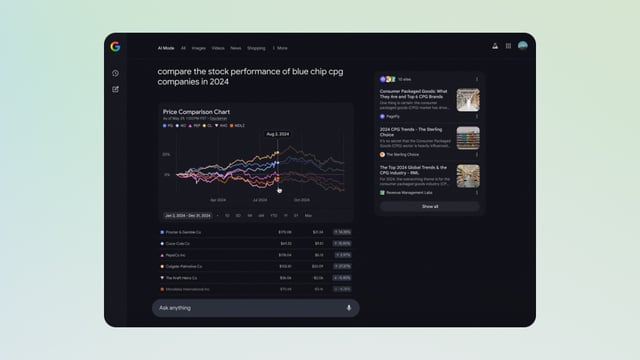
- Google Labs users now get custom visualizations for financial queries such as stock performance comparisons.
- Users can pose natural follow-up questions in AI Mode to request additional metrics like dividend payouts.
- The visualization tool relies on Gemini’s advanced multimodal reasoning to analyze and format current and historical financial data.
- The feature is still experimental in Google Labs and currently supports only financial queries with no set date for wider release.
- Industry experts suggest that publishers enrich their offerings with in-depth analysis or expert commentary to offset potential traffic declines from direct visual answers.