Overview
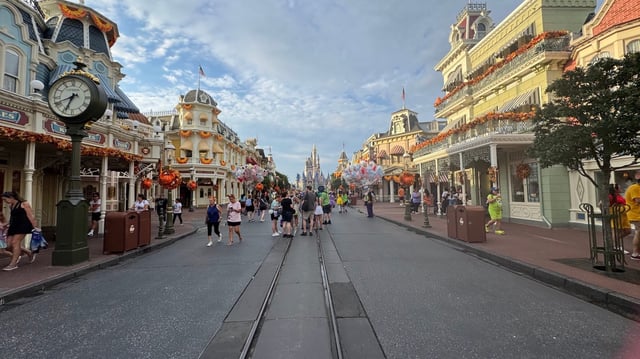
- Aggregated My Disney Experience data analyzed by Thrill-Data and Disney Tourist Blog show average standby waits of about 24 minutes from mid‑August to mid‑September, the slowest three‑week period since 2021.
- Guests’ social‑media posts from Labor Day weekend captured near‑empty scenes and walk‑ons for marquee rides such as Space Mountain, Haunted Mansion, and Pirates of the Caribbean.
- Disney’s recent reporting describes attendance as mostly unchanged with revenue still growing, underscoring a gap between on‑the‑ground wait times and company metrics.
- Analysts point to operational shifts like adjusting Lightning Lane allocations and seasonal factors including early closures for Mickey’s Not‑So‑Scary Halloween Party as contributors to shorter standby waits.
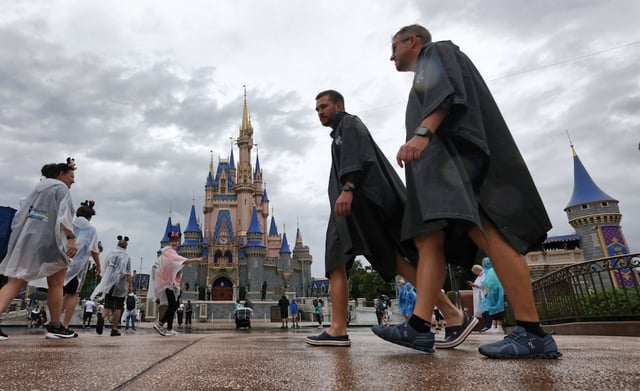
- Higher trip costs and ongoing construction or attraction closures are cited as additional drags on demand, with some observers expecting an October bump tied to resident offers and holiday‑weekend travel.