


Overview
- Bitcoin slipped below $109,000 late Thursday and hovered near $110,000 Friday afternoon, leaving it roughly 5% lower on the week and about 10% off its mid‑August peak.
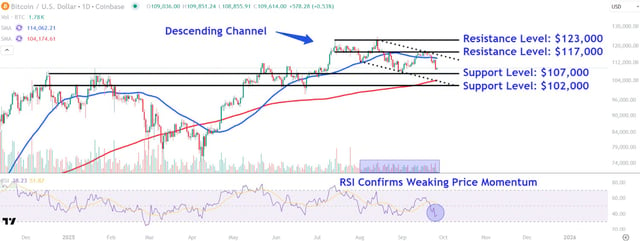
- Since a bearish engulfing at the record high, price has tracked a descending channel, fallen below the 50‑day moving average, and seen RSI turn bearish as Coinbase spot volumes stay subdued.
- Intraday Bollinger Bands and ATR have compressed with trading clustered around $108k–$113k, and analysts expect volatility to release into a move of roughly $10k–$15k.
- Key levels now center on support near $107,000 and $102,000 and resistance around $117,000 and $123,000, with a break under the $108k band risking liquidations toward $103k–$100k and, in deeper scenarios, the mid‑$90k.
- The week’s options expiry, spot ETF flow trends, and incoming macro data are the immediate catalysts, while short‑term charts remain bearish below nearby moving averages with trend‑line resistance near $110,500 and $113,000.