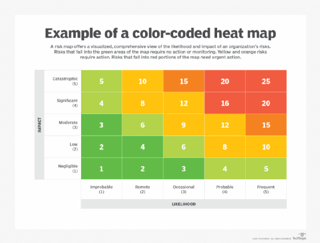
A heat map is a 2-dimensional data visualization technique that represents the magnitude of individual values within a dataset as a color. The variation in color may be by hue or intensity. From Wikipedia
Environet’s Exposed map highlights Bristol, Bolton, Stoke-on-Trent and Worcester as major knotweed hotspots with homeowners urged to verify sightings before peak growth season