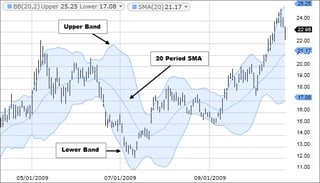
Bollinger Bands are a type of statistical chart characterizing the prices and volatility over time of a financial instrument or commodity, using a formulaic method propounded by John Bollinger in the 1980s. From Wikipedia
The AI-driven framework lets software agents execute payments, focusing traders on a rare volatility squeeze.