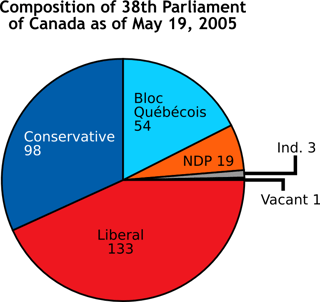
A chart is a graphical representation for data visualization, in which "the data is represented by symbols, such as bars in a bar chart, lines in a line chart, or slices in a pie chart". From Wikipedia
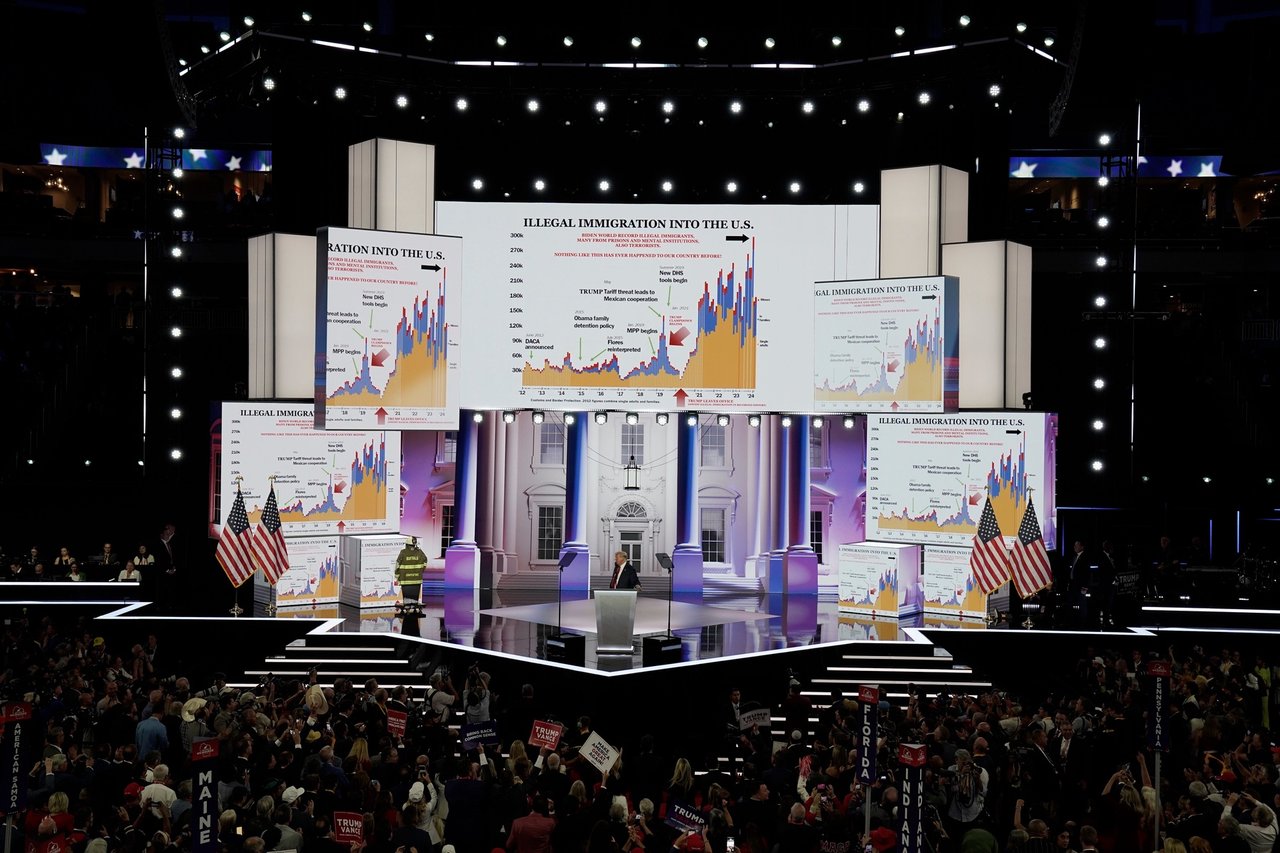
Former president showcases controversial chart during RNC speech, linking it to his survival of recent assassination attempt.